Most reliability work happens after something breaks.
An alert fires. Someone gets paged. The investigation begins. The same questions surface: what changed, which service is affected, what's the blast radius. And the same engineers answer them, again.
It works. Until it doesn't scale.
NOFire Workflows are the answer to that cycle. They are always-on agents that respond to alerts, complete investigations, check production health, and act, without waiting for a human to start them.
What a Workflow Is
A workflow in NOFire is the combination of three things:
- A trigger: the event that starts it. A Slack alert. A completed investigation. A GitHub push. A scheduled cron. A webhook. A manual command from chat.
- Instructions: natural language that tells the agent what to do. Written by your team once, reused on every run.
- An output: where the result goes. A Slack channel, a thread reply, a webhook endpoint, or stored silently in the run history.
Every workflow runs against your Production Context Graph: the live map of your services, dependencies, recent deployments, and incident history. The agent doesn't just follow instructions; it understands your production.
Three Workflows Ready Out of the Box
When you connect NOFire, three workflows are seeded automatically. You can edit them, disable them, or use them as a starting point for your own.
Proactive Health Check
Trigger: Scheduled every 15 minutes
What it does: Scans your highest-risk entities (ranked by alert frequency and dependency count) looking for error rates trending up below the alert threshold, latency increasing vs. the same window yesterday, and recent deployments that correlate with the drift. If degradation is found, it posts to #ops-proactive with the affected service, likely cause, and blast radius. It checks whether it already warned about the same entity in the last hour to avoid noise.
Output: Slack channel (#ops-proactive). Posts only when something needs attention.
This is the workflow that catches problems 15–20 minutes before your alerting system fires. The one that prevents the 3 AM page.
Post-Mortem Analysis
Trigger: Investigation complete
What it does: Generates a structured post-mortem: timeline, root cause, impact assessment, what went well, what to improve, and actionable follow-ups. Checks the knowledge store for recurring patterns and flags if this root cause has appeared before.
Output: Slack channel (#post-mortems).
No one writes post-mortems at 3 AM. This workflow does it while the investigation is still fresh.
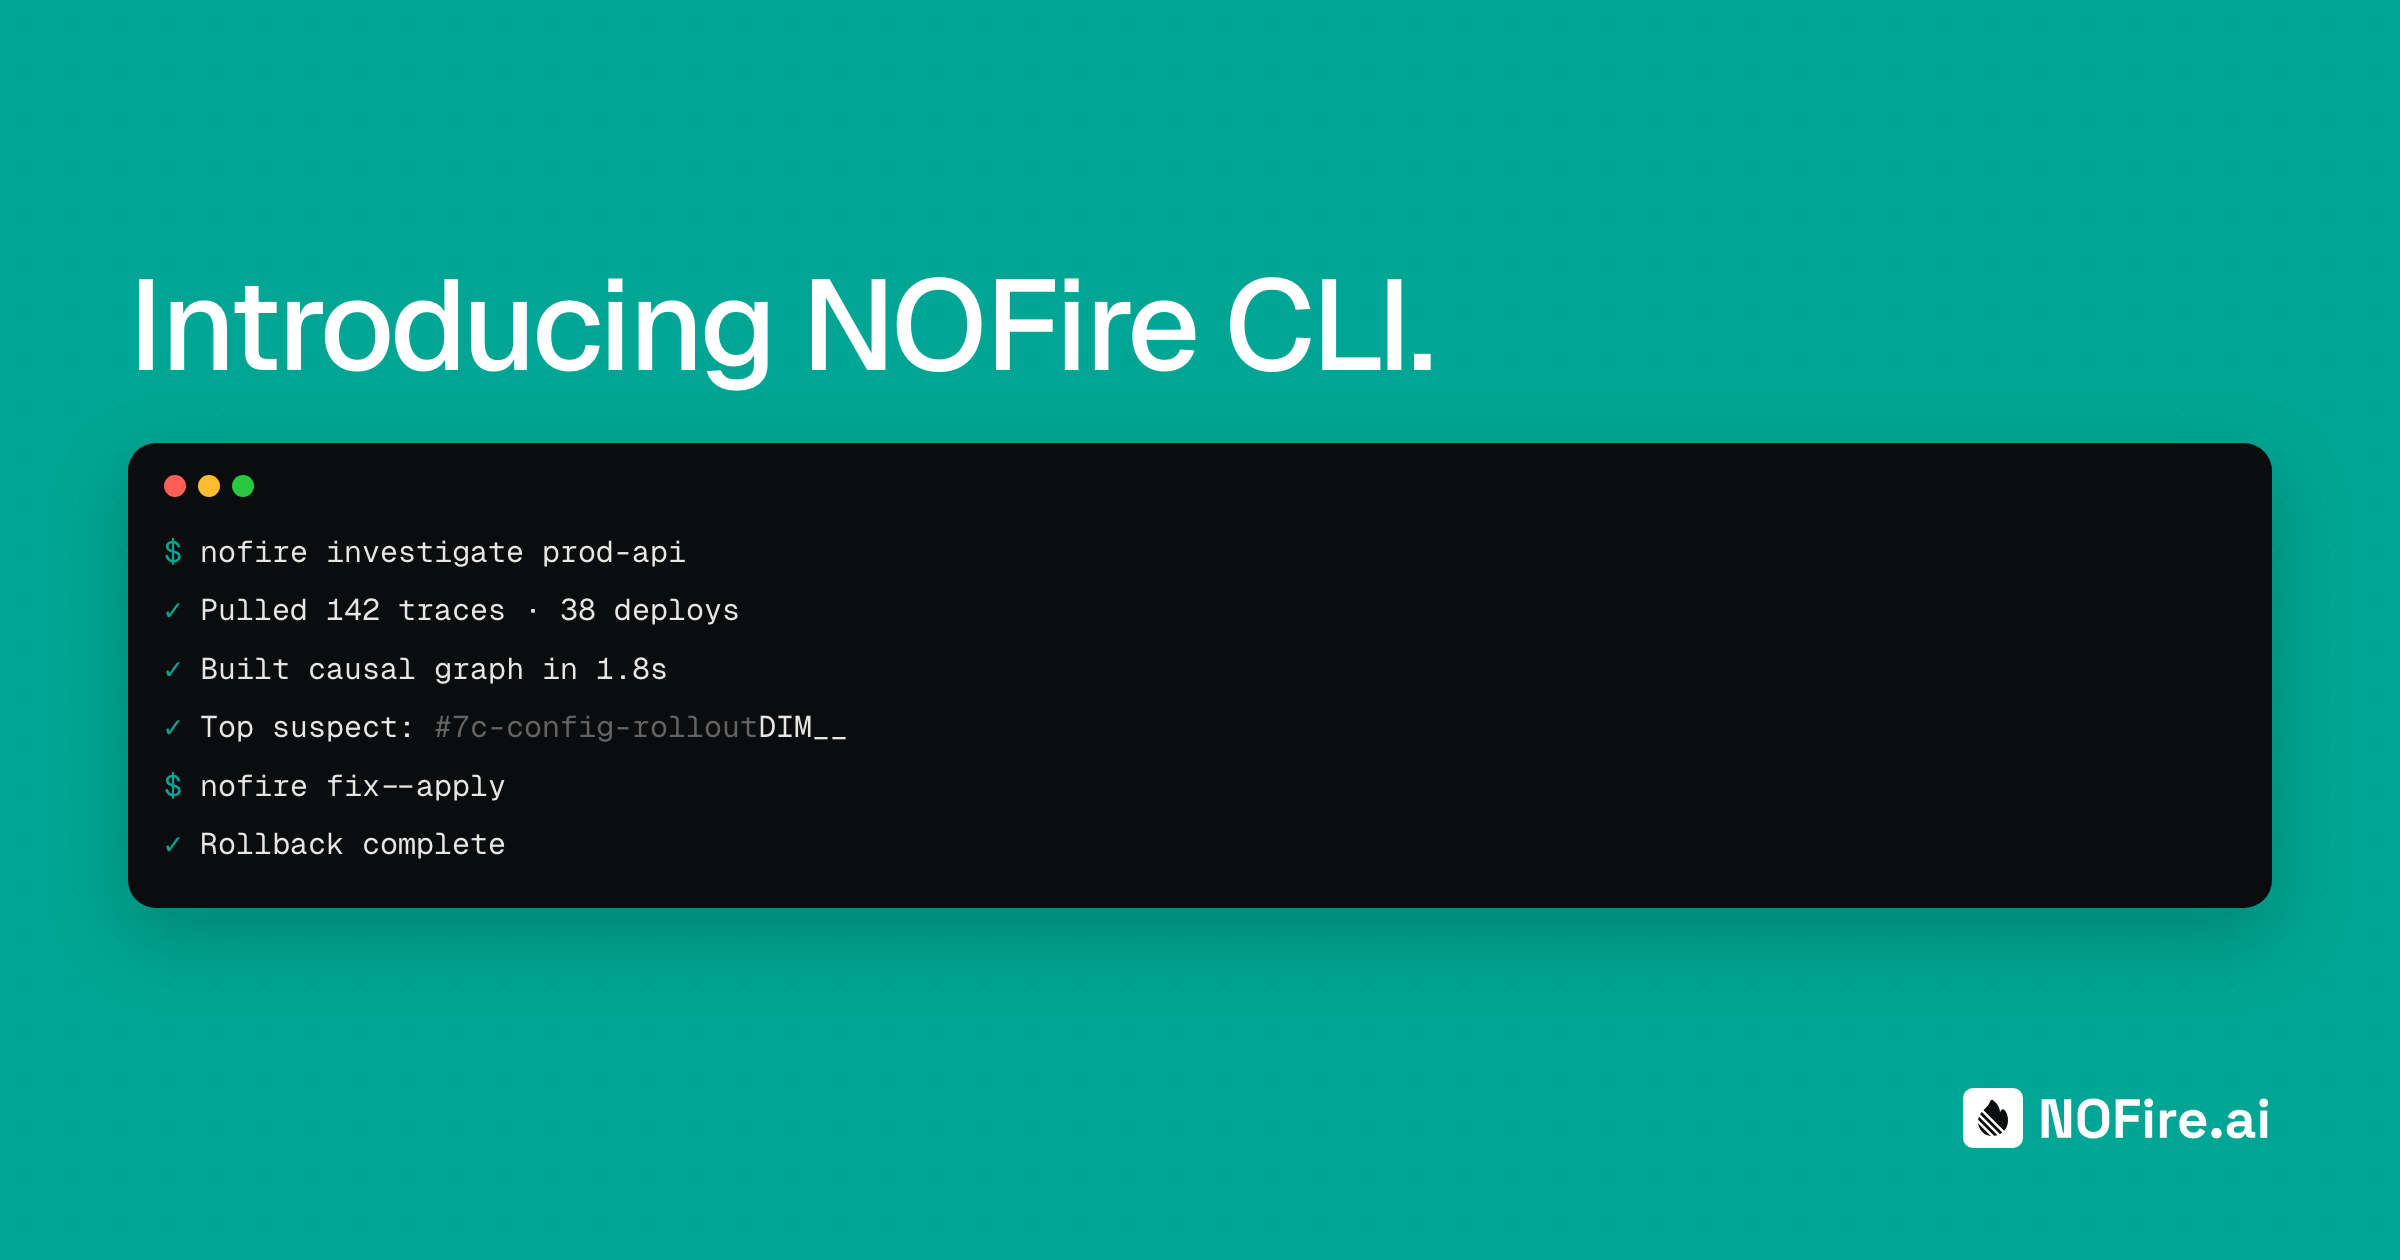
Investigate
Trigger: On-demand command (/investigate)
What it does: Starts or continues a convergent root cause analysis from chat. Pass it a service name, a symptom, or a time window and it runs multi-signal investigation across logs, metrics, traces, and deployment history, returning a draft diagnosis in the same thread.
Output: Slack thread reply.
Build Your Own
The three defaults are a starting point. The catalog has more, and your team can build anything.
Write instructions in plain language. Pick the trigger. Choose where the output lands. Every workflow has access to your full Production Context Graph, the same live data that powers NOFire's investigations.
Post-deploy validation. Triggered on every GitHub push to production. The agent waits 10 minutes for the deploy to settle, then compares error rates, latency p50/p95/p99, and throughput against the pre-deploy baseline. Checks logs for new error patterns that didn't exist before. Checks whether downstream services are showing degradation. If a regression is found, it identifies the specific commit and recommends a rollback. If healthy, it posts a green confirmation to #deploys.
Pre-merge risk assessment. Triggered on every pull request. The agent maps the changed files to entities in the context graph and scores each affected entity for blast radius, incident history in the last 30 days, and active anomalies. Returns a risk score (LOW / MEDIUM / HIGH / CRITICAL) as a PR comment, giving teams a signal before anything ships.
Production readiness review. Scheduled weekly (Monday 9 AM). For every service in the cluster, the agent evaluates whether it's production-ready: metrics in the catalog, alerts configured, observability coverage, dependency blast radius, incident count in the last 30 days. Each service gets a verdict (READY / NEEDS ATTENTION / NOT READY) posted to #platform-team.
Compliance drift detection. Scheduled daily at 6 AM. Scans for new compliance drift since yesterday using AWS Config and CloudTrail: security groups open to the internet, unencrypted RDS or S3 buckets, IAM policies with unexpected admin access. Only reports what is new, so the channel stays signal-dense. Posted to #security-compliance.
Weekly operational report. Scheduled every Monday morning. Summarizes total incidents by severity vs. the previous week, top 5 noisiest entities, MTTR by team and service, repeat offenders, and deployment risk summary. Posted to #eng-leadership before the first standup.
How It Works
Each workflow runs as an isolated agent invocation. The trigger fires, the agent receives the trigger context alongside your team's instructions, and it runs against the production context graph. Results are delivered and stored in the run history for audit and review.
Triggers, instructions, and delivery are fully decoupled. A Slack alert doesn't know about your instructions. Your instructions don't know about the delivery channel. The agent sits in between, with access to everything that matters.
Idempotency is handled at the run level. The same alert firing twice won't produce duplicate investigations.
Trigger sources currently supported: Slack alerts, Grafana IRM incidents, GitHub events (push, pull_request, and others), investigation completions, webhooks, scheduled cron, and on-demand commands.
The Shift This Makes
Monitoring tells you something broke. Workflows understand what broke and often act on it before you've had a chance to open your laptop.
The health check fires at 3:15 AM. It spots latency drift on the checkout service, below the alert threshold but trending. It cross-references recent deployments, finds a correlation, and posts to #ops-proactive with the affected service and a likely cause. By the time the engineer wakes up, the signal is already there.
That's not magic. That's a well-written workflow running against a complete picture of production.
Workflows are available now. If you're already on NOFire, they're in your sidebar. If you're new, start here and they'll be ready when you connect your first integration.